Environment & Versions
python==3.12
pandas==2.2.2python==3.12
pandas==2.2.2Reading CSV Files:
pd.read_csv(path) to load a CSV file into a Pandas DataFrame./ (or escaped backslashes \\ for Win).# import data
import pandas as pd
path = "../../../src/data/beer-and-curry.csv"
df = pd.read_csv(path) # read csv file into a DataFrame
df.head(2) # view first 2 rows| created_at | utc_time | mentions | text | url | retweet_count | favorite_count | user | user.location | user.followers_count | user.friends_count | user.created_at | user.favourites_count | user.verified | |
|---|---|---|---|---|---|---|---|---|---|---|---|---|---|---|
| 0 | 06/05/2020 | 11:11:49 | NaN | NINE SPICES?????????????????\n?9??SPICE????NIN... | https://t.co/wddjIaJTcD | 24 | 12 | 9spices | ??????????2-1-2 HANROKU??B1 | 3820 | 1961 | 10/02/2010 | 296 | False |
| 1 | 07/07/2020 | 08:08:54 | @lizzie_hubbard2 @JetsettersFlyin @suziday123 ... | Thanks for the invite to join #TravelWinePart... | https://t.co/6Z7GgkJE8v | 6 | 17 | ExpressionsSA | Cape Town South Africa | 5088 | 5284 | 24/06/2011 | 15625 | False |
Use dropna() to remove rows with missing values in the columns required for analysis.
# drop rows where 'text' or 'retweet_count' is missing (value is NA or NaN)
df_clean = df.dropna(subset=["text", "retweet_count"])
Dropping Missing Values:
df.dropna() to remove rows containing missing values (NA or NaN).subset as a list of column names to only consider missing values in those columns for removal.() or square brackets [] for the subset list.Note: For data preprocessing, selectively drop rows with missing values only in columns relevant to your analysis to maintain data accuracy.
df.shape # view original shape (num of rows, num of cols)(430, 14)df_clean.shape # shape after dropping rows with missing values(429, 14)Use fillna() when a missing value should be replaced rather than removed.
# fill missing values in 'mentions' with a placeholder string
df["mentions"] = df["mentions"].fillna("No Mentioned User")

# view replaced values in 'mentions' column
df.head(3)["mentions"]
0 No Mentioned User
1 @lizzie_hubbard2 @JetsettersFlyin @suziday123 ...
2 @craftbeerncl! @RidgesideBrewer @Manjitskitche...
Name: mentions, dtype: objectFilling Missing Values:
df.fillna(value) to replace missing values in a specific column with a placeholder, such as a string.Use replace() to convert placeholder values into a more useful representation.
# replace the placeholder string with 0
df["mentions"] = df["mentions"].replace("No Mentioned User", 0)

# view replaced values in 'mentions' column
df.head(3)["mentions"]
0 0
1 @lizzie_hubbard2 @JetsettersFlyin @suziday123 ...
2 @craftbeerncl! @RidgesideBrewer @Manjitskitche...
Name: mentions, dtype: objectReplacing Specific Values:
df.replace(old_value, new_value) to substitute specific values in a column.Use rename() to make column names shorter and more descriptive.
# rename 'text' to 'content' and 'created_at' to 'date'
df = df.rename(columns={"text": "content", "created_at": "date"})

# view renamed columns
df.head(2)| date | utc_time | mentions | content | url | retweet_count | favorite_count | user | user.location | user.followers_count | user.friends_count | user.created_at | user.favourites_count | user.verified | |
|---|---|---|---|---|---|---|---|---|---|---|---|---|---|---|
| 0 | 06/05/2020 | 11:11:49 | 0 | NINE SPICES?????????????????\n?9??SPICE????NIN... | https://t.co/wddjIaJTcD | 24 | 12 | 9spices | ??????????2-1-2 HANROKU??B1 | 3820 | 1961 | 10/02/2010 | 296 | False |
| 1 | 07/07/2020 | 08:08:54 | @lizzie_hubbard2 @JetsettersFlyin @suziday123 ... | Thanks for the invite to join #TravelWinePart... | https://t.co/6Z7GgkJE8v | 6 | 17 | ExpressionsSA | Cape Town South Africa | 5088 | 5284 | 24/06/2011 | 15625 | False |
Renaming Columns:
df.rename(columns={'old_name': 'new_name'}) to rename columns using a dictionary.index parameter for renaming indices.Drop rows with missing follower counts before creating derived metrics.
# specify specific column(s) to drop rows with missing values
df = df.dropna(subset=["user.followers_count"])

# view cleaned data with no missing follower counts
df.head(2)| date | utc_time | mentions | content | url | retweet_count | favorite_count | user | user.location | user.followers_count | user.friends_count | user.created_at | user.favourites_count | user.verified | |
|---|---|---|---|---|---|---|---|---|---|---|---|---|---|---|
| 0 | 06/05/2020 | 11:11:49 | 0 | NINE SPICES?????????????????\n?9??SPICE????NIN... | https://t.co/wddjIaJTcD | 24 | 12 | 9spices | ??????????2-1-2 HANROKU??B1 | 3820 | 1961 | 10/02/2010 | 296 | False |
| 1 | 07/07/2020 | 08:08:54 | @lizzie_hubbard2 @JetsettersFlyin @suziday123 ... | Thanks for the invite to join #TravelWinePart... | https://t.co/6Z7GgkJE8v | 6 | 17 | ExpressionsSA | Cape Town South Africa | 5088 | 5284 | 24/06/2011 | 15625 | False |
Creating New Columns:
df.dropna(subset=['column']).Create a new column by applying a vectorized calculation to an existing column.
# create a new column 'followers_k' by dividing 'user.followers_count' by 1000
df["followers_k"] = df["user.followers_count"] / 1000

# view the new column alongside the original follower count
df.head(3)[["followers_k", "user.followers_count"]]| followers_k | user.followers_count | |
|---|---|---|
| 0 | 3.820 | 3820 |
| 1 | 5.088 | 5088 |
| 2 | 0.446 | 446 |
Creating New Columns:
df['new_col'] = df['existing_col'] / 1000.Define a reusable function when the transformation is clearer as named logic.
# define a function to calculate engagement rate (ER) as a percentage
def calc_er(engagement_count, follower_count):
    return (engagement_count / follower_count) * 100
# apply and assign the calculated engagement rate to a new column 'er_rt_fo'
df["er_rt_fo"] = calc_er(
df["retweet_count"],
df["user.followers_count"],
)
# view the new engagement rate column alongside the original metrics
df.head(3)[["er_rt_fo", "retweet_count", "user.followers_count"]]| er_rt_fo | retweet_count | user.followers_count | |
|---|---|---|---|
| 0 | 0.628272 | 24 | 3820 |
| 1 | 0.117925 | 6 | 5088 |
| 2 | 0.896861 | 4 | 446 |
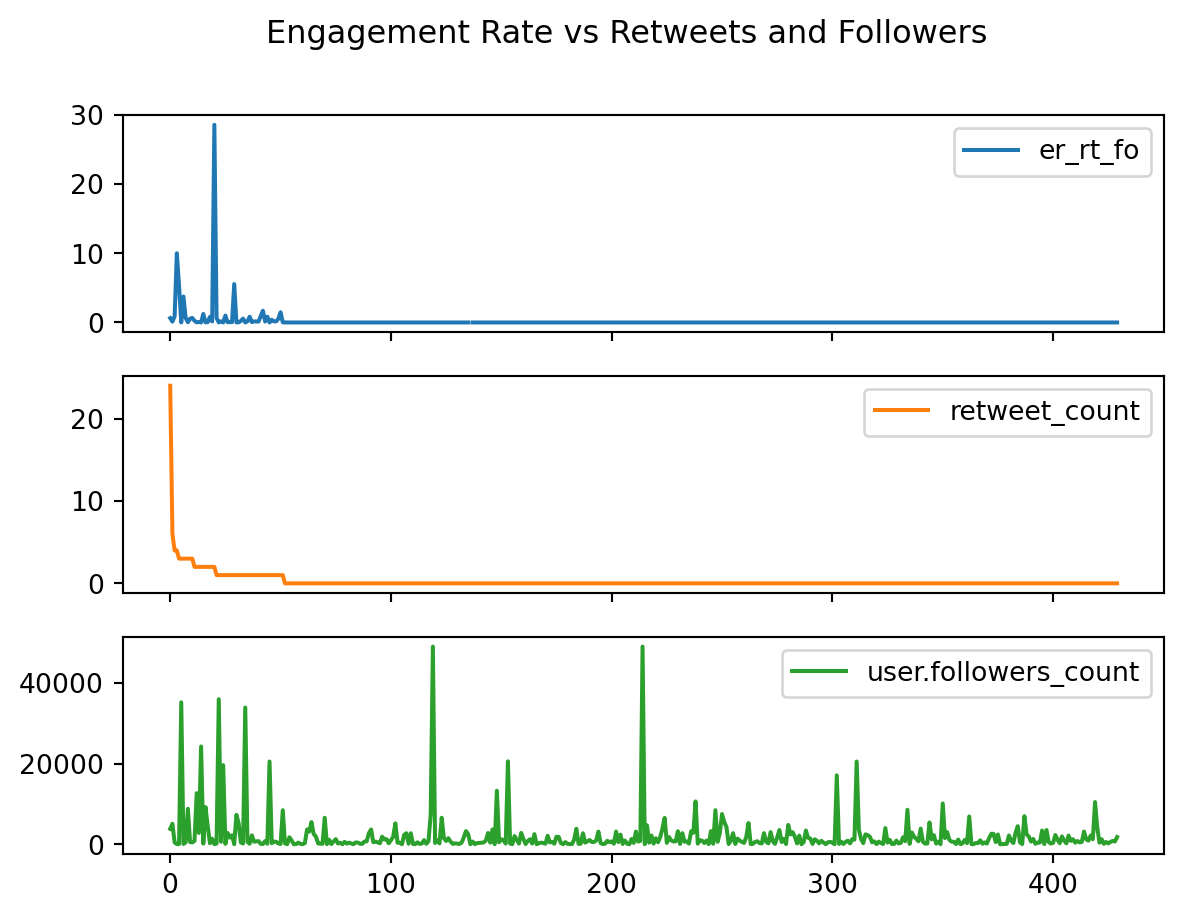
# visualize the relationship between engagement rate & two other metrics
ax = df[["er_rt_fo", "retweet_count", "user.followers_count"]].plot(
    subplots=True,
    title="Engagement Rate vs Retweets and Followers",
)
Creating New Columns:
.values if needed to extract array from Series.df.plot() with subplots=True for separate plots, figsize for dimensions, and kind for plot types (default ‘line’, options include ‘bar’, ‘hist’, ‘scatter’, ‘pie’).Remove fully duplicated rows with duplicated().
# drop fully duplicated rows (keep the first occurrence)
# ~ is the negation operator
df = df[~df.duplicated()]
Finding Duplicates:
df.duplicated() to identify duplicate rows; it returns a boolean Series.~df.duplicated() to keep only unique rows.subset as a list of columns to check for duplicates based on those columns only.keep=False to mark all duplicates.Find users who posted multiple times on the same date by specifying a subset of columns.
# find duplicated rows based on 'user' and 'date' columns (keep all occurrences)
df[df.duplicated(subset=["user", "date"], keep=False)].head(2)| date | utc_time | mentions | content | url | retweet_count | favorite_count | user | user.location | user.followers_count | user.friends_count | user.created_at | user.favourites_count | user.verified | followers_k | er_rt_fo | |
|---|---|---|---|---|---|---|---|---|---|---|---|---|---|---|---|---|
| 7 | 29/02/2020 | 14:42:01 | @MCRCycleSam @CatrionaSwanson @bricycle @marty... | A gathering of UK transport activists; cycle s... | https://t.co/OcyyKkhmUh | 3 | 15 | davelostdave | somewhere | 459 | 1287 | 15/06/2009 | 23700 | False | 0.459 | 0.653595 |
| 10 | 29/02/2020 | 23:41:58 | @CatrionaSwanson @Chris_Boardman @Chris_Boardman | Maybe we could put the spotlight on #Bradford ... | https://t.co/0ExO7wr1ld | 3 | 11 | davelostdave | somewhere | 459 | 1287 | 15/06/2009 | 23700 | False | 0.459 | 0.653595 |
Sort rows by multiple columns with sort_values().
# sort by 'retweet_count' and then by 'user.followers_count' descending
df.sort_values(
    by=["retweet_count", "user.followers_count"],
    ascending=False,
).head(2)| date | utc_time | mentions | content | url | retweet_count | favorite_count | user | user.location | user.followers_count | user.friends_count | user.created_at | user.favourites_count | user.verified | followers_k | er_rt_fo | |
|---|---|---|---|---|---|---|---|---|---|---|---|---|---|---|---|---|
| 0 | 06/05/2020 | 11:11:49 | 0 | NINE SPICES?????????????????\n?9??SPICE????NIN... | https://t.co/wddjIaJTcD | 24 | 12 | 9spices | ??????????2-1-2 HANROKU??B1 | 3820 | 1961 | 10/02/2010 | 296 | False | 3.820 | 0.628272 |
| 1 | 07/07/2020 | 08:08:54 | @lizzie_hubbard2 @JetsettersFlyin @suziday123 ... | Thanks for the invite to join #TravelWinePart... | https://t.co/6Z7GgkJE8v | 6 | 17 | ExpressionsSA | Cape Town South Africa | 5088 | 5284 | 24/06/2011 | 15625 | False | 5.088 | 0.117925 |
Reordering and Reshaping:
df.sort_values(by=['col1', 'col2'], ascending=False) to sort rows by multiple columns in descending order.df.transpose() to swap rows and columns.Transpose the DataFrame when you need to switch rows and columns for inspection.
df.transpose().head(3) # view the DataFrame with rows and columns swapped| 0 | 1 | 2 | 3 | 4 | 5 | 6 | 7 | 8 | 9 | ... | 420 | 421 | 422 | 423 | 424 | 425 | 426 | 427 | 428 | 429 | |
|---|---|---|---|---|---|---|---|---|---|---|---|---|---|---|---|---|---|---|---|---|---|
| date | 06/05/2020 | 07/07/2020 | 31/03/2020 | 29/05/2020 | 28/11/2020 | 01/07/2020 | 08/01/2020 | 29/02/2020 | 03/05/2020 | 16/01/2020 | ... | 10/04/2020 | 27/11/2020 | 09/12/2020 | 25/03/2020 | 25/06/2020 | 30/12/2020 | 30/08/2020 | 04/03/2020 | 10/08/2020 | 07/03/2020 |
| utc_time | 11:11:49 | 08:08:54 | 13:39:02 | 20:58:17 | 04:46:37 | 06:35:04 | 10:26:36 | 14:42:01 | 17:05:51 | 17:50:08 | ... | 23:23:26 | 23:31:09 | 23:32:06 | 23:36:02 | 23:38:41 | 23:45:00 | 23:54:19 | 23:55:19 | 23:55:38 | 23:59:42 |
| mentions | 0 | @lizzie_hubbard2 @JetsettersFlyin @suziday123 ... | @craftbeerncl! @RidgesideBrewer @Manjitskitche... | @StCannas @keralankaravan | @yooneedmorejodi | 0 | 0 | @MCRCycleSam @CatrionaSwanson @bricycle @marty... | @DrewPritchard | @Nellachops73 @MotorheadBeer @CameronsBrewery ... | ... | @ashley_collings | @101andyhibberd | @MariaMo71609443 @jckiker @ScottAdamsSays | @lonelyplanet | 0 | @Photos_in_Chile | @jesshousty @WilliamHousty | @beer_porter @siretoknote | 0 | 0 |
3 rows × 430 columns
Load a second dataset and combine it with concat().
path2 = "../../../src/data/keto-and-vegan.csv"
df2 = pd.read_csv(path2, encoding="latin-1") # load df
df2.head(2) # view first 2 rows| created_at | utc_time | mentions | text | url | retweet_count | favorite_count | user | user.location | user.followers_count | user.friends_count | user.created_at | user.favourites_count | user.verified | |
|---|---|---|---|---|---|---|---|---|---|---|---|---|---|---|
| 0 | 01/01/2020 | 23:10:27 | @BioLayne | is one of the most respected and unbiased nutr... | https://t.co/WDDhoIvXl5 | 0 | 0 | Eric_OGrey | Sacramento, CA | 2333 | 1084 | 10/03/2016 | 23996 | False |
| 1 | 02/01/2020 | 18:16:26 | @greggprescott1 | I am O +, which is high protein, than fat, the... | https://t.co/1hBpp6MGnu | 0 | 0 | Glory32X | Belgium | 636 | 64 | 11/07/2009 | 22357 | False |
Append matching tables vertically:
# concatenate df and df2 vertically (stack rows)
pd.concat([df, df2]).iloc[428:432,] # view row 428 to 431| date | utc_time | mentions | content | url | retweet_count | favorite_count | user | user.location | user.followers_count | user.friends_count | user.created_at | user.favourites_count | user.verified | followers_k | er_rt_fo | created_at | text | |
|---|---|---|---|---|---|---|---|---|---|---|---|---|---|---|---|---|---|---|
| 428 | 10/08/2020 | 23:55:38 | 0 | Made the terrible horrible no-good mistake of ... | https://t.co/AF23qFRBTv | 0 | 3 | elizvogt | NYC now, Texas forever | 687 | 1105 | 07/03/2011 | 39909 | False | 0.687 | 0.0 | NaN | NaN |
| 429 | 07/03/2020 | 23:59:42 | 0 | This is how I'm celebrating tonight y'all! Bee... | https://t.co/Fh7wRYCguR | 0 | 30 | Rose262 | Atlanta, GA | 1776 | 1121 | 10/05/2009 | 30246 | False | 1.776 | 0.0 | NaN | NaN |
| 0 | NaN | 23:10:27 | @BioLayne | NaN | https://t.co/WDDhoIvXl5 | 0 | 0 | Eric_OGrey | Sacramento, CA | 2333 | 1084 | 10/03/2016 | 23996 | False | NaN | NaN | 01/01/2020 | is one of the most respected and unbiased nutr... |
| 1 | NaN | 18:16:26 | @greggprescott1 | NaN | https://t.co/1hBpp6MGnu | 0 | 0 | Glory32X | Belgium | 636 | 64 | 11/07/2009 | 22357 | False | NaN | NaN | 02/01/2020 | I am O +, which is high protein, than fat, the... |
Joining Data:
pd.read_csv() and specify encoding if necessary.pd.concat([df1, df2]) to vertically concatenate DataFrames with matching columns..reset_index(drop=True) to create a continuous index.Reset the index after concatenation when you want a continuous row index.
# concatenate df and df2, then reset the index
pd.concat([df, df2]).reset_index(drop=True).iloc[428:432,]| date | utc_time | mentions | content | url | retweet_count | favorite_count | user | user.location | user.followers_count | user.friends_count | user.created_at | user.favourites_count | user.verified | followers_k | er_rt_fo | created_at | text | |
|---|---|---|---|---|---|---|---|---|---|---|---|---|---|---|---|---|---|---|
| 428 | 10/08/2020 | 23:55:38 | 0 | Made the terrible horrible no-good mistake of ... | https://t.co/AF23qFRBTv | 0 | 3 | elizvogt | NYC now, Texas forever | 687 | 1105 | 07/03/2011 | 39909 | False | 0.687 | 0.0 | NaN | NaN |
| 429 | 07/03/2020 | 23:59:42 | 0 | This is how I'm celebrating tonight y'all! Bee... | https://t.co/Fh7wRYCguR | 0 | 30 | Rose262 | Atlanta, GA | 1776 | 1121 | 10/05/2009 | 30246 | False | 1.776 | 0.0 | NaN | NaN |
| 430 | NaN | 23:10:27 | @BioLayne | NaN | https://t.co/WDDhoIvXl5 | 0 | 0 | Eric_OGrey | Sacramento, CA | 2333 | 1084 | 10/03/2016 | 23996 | False | NaN | NaN | 01/01/2020 | is one of the most respected and unbiased nutr... |
| 431 | NaN | 18:16:26 | @greggprescott1 | NaN | https://t.co/1hBpp6MGnu | 0 | 0 | Glory32X | Belgium | 636 | 64 | 11/07/2009 | 22357 | False | NaN | NaN | 02/01/2020 | I am O +, which is high protein, than fat, the... |
Use groupby() with agg() to compute summary statistics by group. The example below calculates total retweets and average follower count for each user.
# group by 'user', then aggregate 'retweet_count' with sum
# and 'user.followers_count' with mean
df_agg = df.groupby("user").agg(
    {"retweet_count": "sum", "user.followers_count": "mean",}
)

# view the aggregated result
df_agg.head(3)| retweet_count | user.followers_count | |
|---|---|---|
| user | ||
| 1nnkeeper | 0 | 557.0 |
| 353a9f40f97e4a9 | 2 | 4440.0 |
| 6M70_JET | 0 | 548.0 |
Grouping and Aggregation:
df.groupby('column').agg({'col1': 'sum', 'col2': 'mean'}) to group by a column and compute aggregate statistics.df[~df.duplicated(subset='column')].shape or df['column'].nunique().You can compare the grouped result with the number of unique users:
# count unique users by dropping duplicates based on 'user' column
df[~df.duplicated(subset="user")].shape
(390, 16)# or simply count the number of unique users with nunique()
df["user"].nunique()390Melting: wide → long
Use melt() to convert wide data into long format for analysis and plotting.
# create a sample wide-format DataFrame with pet types and counts
df_wide = pd.DataFrame(
    data=[
        ["cat", 4, 5],
        ["dog", 7, 4],
        ["rabbit", 2, 3],
    ],
    columns=["pet", "male", "female"],
)

df_wide # view it| pet | male | female | |
|---|---|---|---|
| 0 | cat | 4 | 5 |
| 1 | dog | 7 | 4 |
| 2 | rabbit | 2 | 3 |
Without arguments, melt() collapses all columns into variable-value pairs.
df_wide.melt() # melt all cols into variable-value pairs (pivot longer)| variable | value | |
|---|---|---|
| 0 | pet | cat |
| 1 | pet | dog |
| 2 | pet | rabbit |
| 3 | male | 4 |
| 4 | male | 7 |
| 5 | male | 2 |
| 6 | female | 5 |
| 7 | female | 4 |
| 8 | female | 3 |
Specify identifier and value columns for a structured long-format result.
melted_df = pd.melt(
    df_wide,
    id_vars=["pet"], # keep 'pet' as identifier column
    value_vars=["male", "female"], # value columns
    var_name="sex", # name for the new variable column
    value_name="count", # name for the new value column
)Pivot: long → wide
Pivot the long data back to wide format:
df_pivot = melted_df.pivot(
    index="pet", # identifier column becomes index
    columns="sex", # categories in variable column becomes new columns
    values="count", # value column becomes new values
).reset_index() # reset index to turn 'pet' back into a column

df_pivot.columns.name = None # remove the name of the columns index

df_pivot # view the pivoted DataFrame| pet | female | male | |
|---|---|---|---|
| 0 | cat | 5 | 4 |
| 1 | dog | 4 | 7 |
| 2 | rabbit | 3 | 2 |
Use pivot_table() instead of pivot() when there are duplicate index/column combinations, and specify an aggregation function like aggfunc='mean' to summarize duplicates.
For example, if we have duplicate pet entries:
# create a sample DataFrame with duplicate pet entries
df_long = pd.DataFrame(
    data=[
        ["cat", "male", 4],
        ["cat", "female", 5],
        ["dog", "female", 7],
        ["dog", "male", 4],
        ["rabbit", "male", 2],
        ["rabbit", "female", 3],
    ],
    columns=["pet", "sex", "count"],
)
df_long # view the long-format DataFrame with duplicates| pet | sex | count | |
|---|---|---|---|
| 0 | cat | male | 4 |
| 1 | cat | female | 5 |
| 2 | dog | female | 7 |
| 3 | dog | male | 4 |
| 4 | rabbit | male | 2 |
| 5 | rabbit | female | 3 |
To pivot this long data back to wide format, we can use pivot_table() to handle duplicates:
# create a pivot table that averages counts for duplicate entries
(df_long
.pivot_table(
    index="pet",
    columns="sex",
    values="count",
    aggfunc="mean", # average counts for duplicate entries
)
.rename_axis(None, axis=1) # remove the name of the columns headers
.rename_axis(None) # remove the name of the index
)| female | male | |
|---|---|---|
| cat | 5.0 | 4.0 |
| dog | 7.0 | 4.0 |
| rabbit | 3.0 | 2.0 |