Plotly Charts Display in Google Colab
1 Summary
1.1 Problem
After editing an ipynb file in Google Colab and exporting it to HTML, the Plotly charts fail to display.
1.2 Solution
After testing, in Google Colab the ipynb file 1 behaves as follows:
fig.show()displays the chart correctly.fig.show(renderer="notebook_connected")fails to display the chart.
But once exported to HTML 2 and opened in a browser:
- Charts generated by
fig.show()fail to display. - Only charts generated by
fig.show(renderer="notebook_connected")display correctly.
So when editing a notebook in Colab, use the default renderer (fig.show()), and switch the renderer to "notebook_connected" right before exporting to HTML.
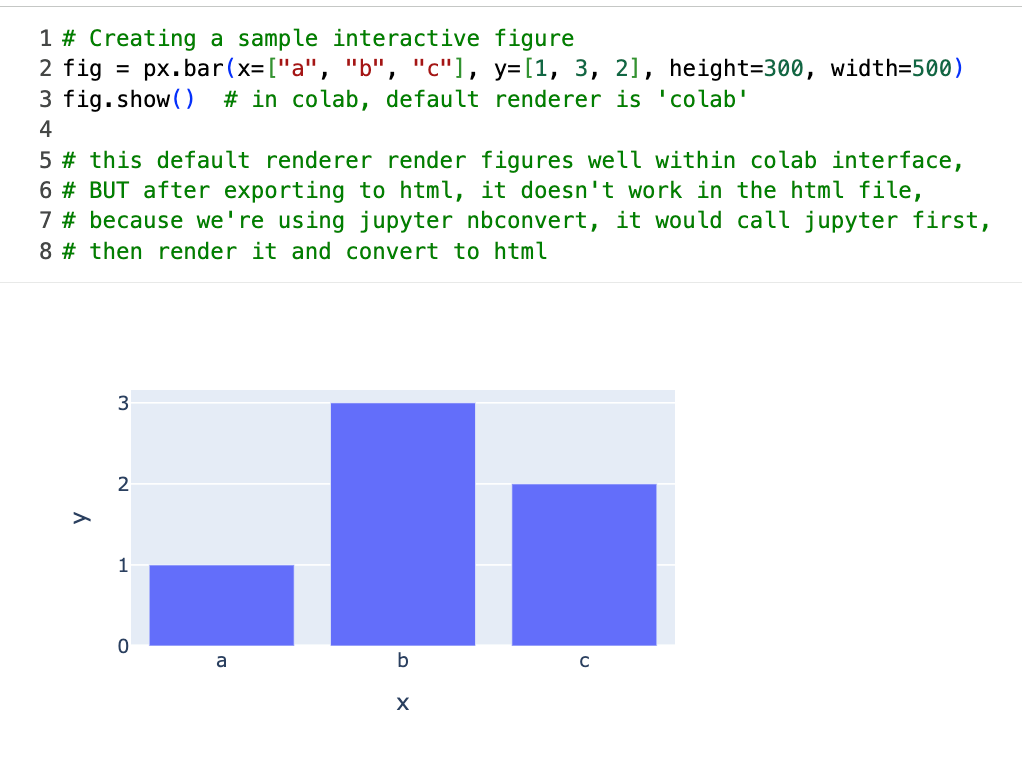
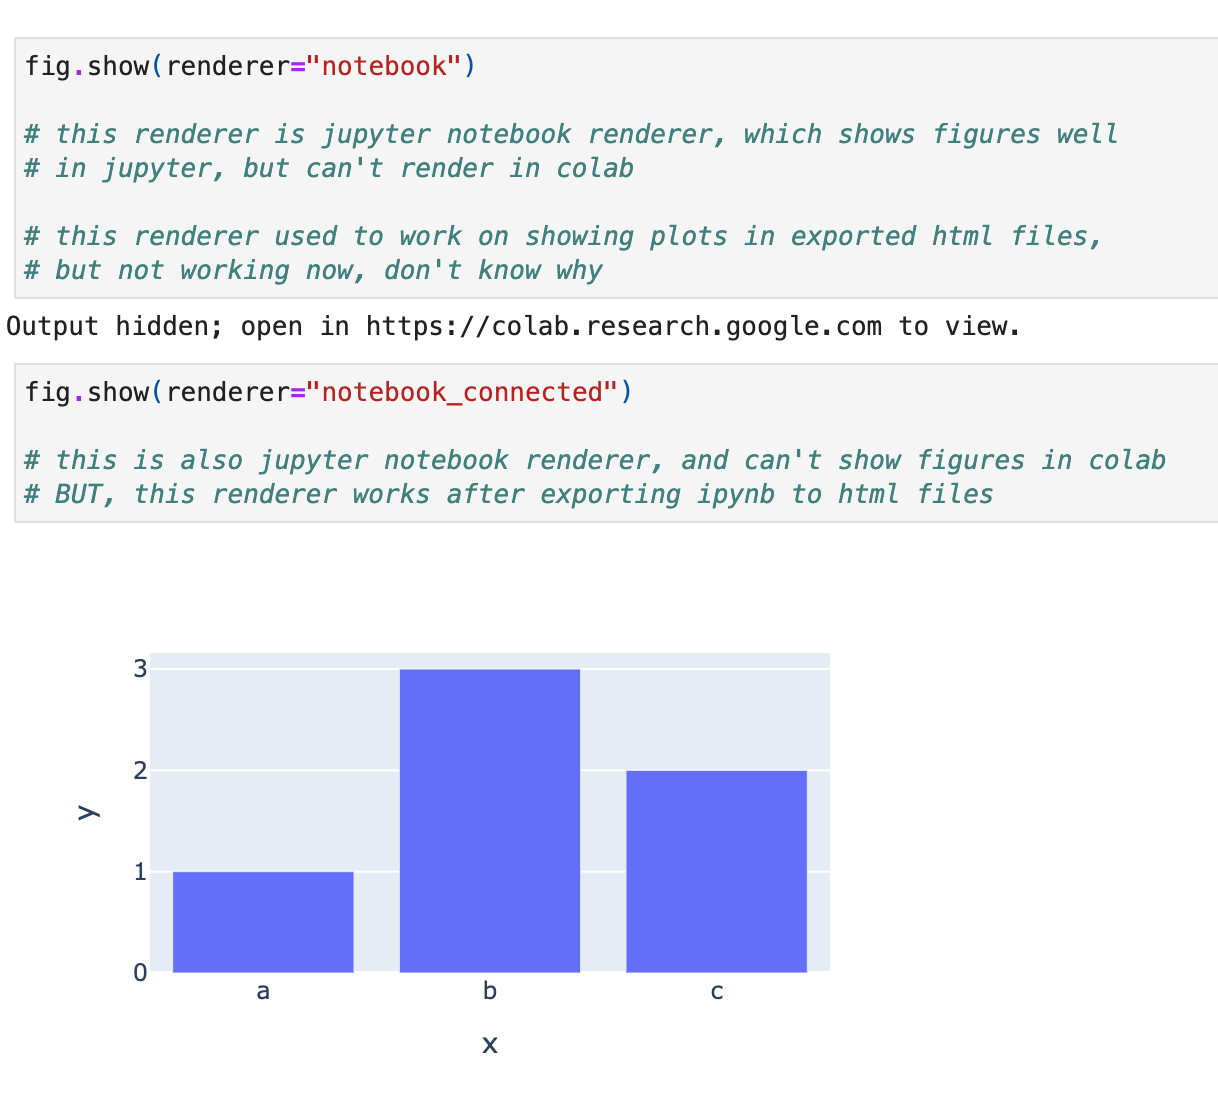
1.3 Notes
After editing an ipynb file in Colab, if you want to export it to HTML, be sure to press Ctrl+S first (saving to Google Drive) so that you export the most recently saved version. If you run the export command without saving first, the exported HTML may not be the latest version, and it may even have missing content or other issues.
Recommended workflow:
- Finish editing the entire ipynb file.
- Choose Runtime → Restart and run all.
- Press Ctrl+S to save the notebook.
- Run the code below in another notebook to export the HTML.
%%shell
jupyter nbconvert --to html /content/drive/MyDrive/path/filename.ipynb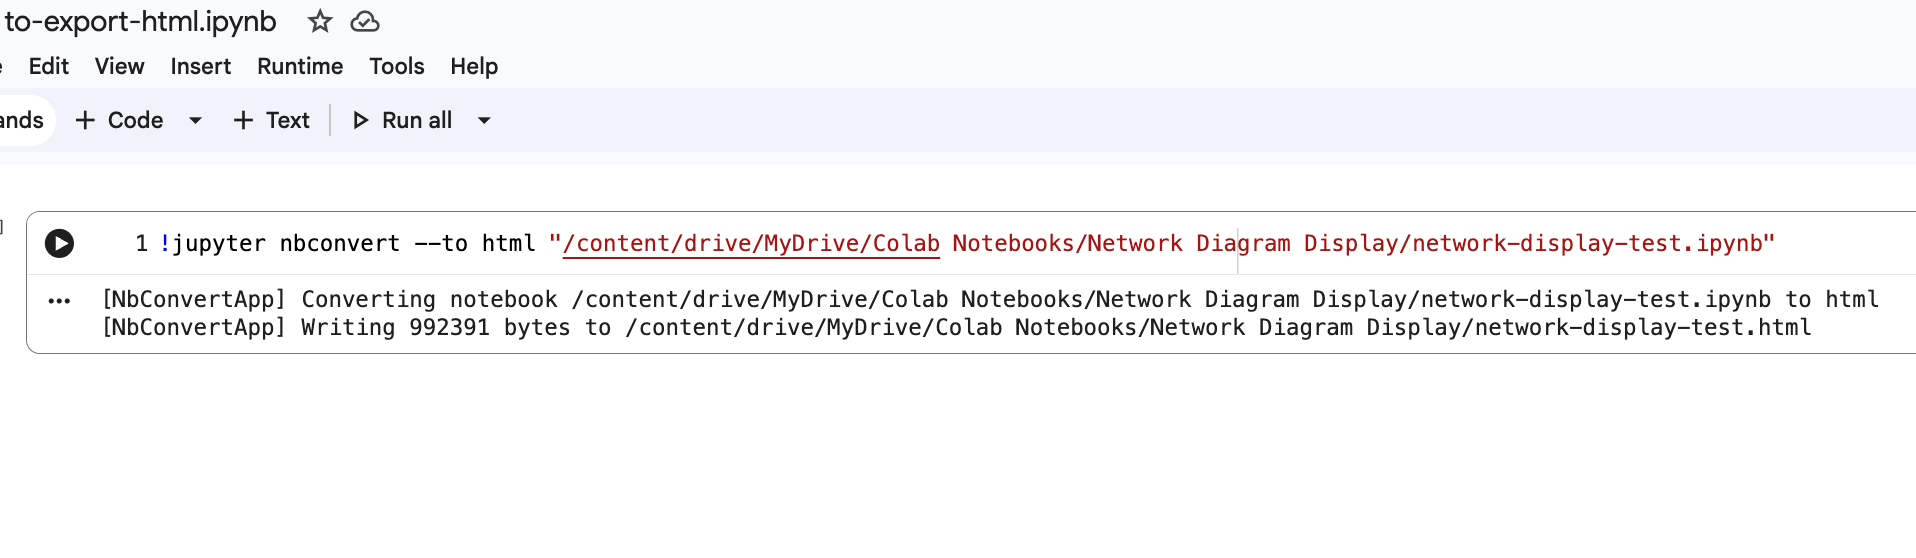
%%shell is a cell magic of Google Colab ( %%bash in Jupyter ) used to run shell commands within a code cell. For a single-line shell command, you can also use !, such as !pip install pyvis.
Footnotes
IPYNB file: View the demo file in Colab or download it↩︎
HTML file: View the demo file in the browser or download it↩︎